Logging Linux CIFS and NFS traffic in Zabbix
The entire script can be downloaded at the end of the article, so no need to copy/paste.
I recently started at a new job where one of the first challenges was to set up monitoring on a large storage cluster. The cluster has two servers acting as NFS gateways and two servers doing CIFS. I wanted to track exactly how much traffic was going through these servers. In short, I had the following goals:
- I want to see exactly how much network data goes in and out
- I want to keep track of IP addresses, so I can see who is taking up the most bandwidth
- I want the extra load on the system to be minimal so it doesn’t interrupt the actual purpose of the server, serving files
- I want to send this data to Zabbix so I can log network traffic
My first idea was using cgroups since that is already used for accounting when working with containers (e.g. docker). Unfortunately I was unable to get it to work. Then I looked into doing network packet accounting via the firewall. Due to a number of reasons this also didn’t turn into a workable solution.
Then SystemTap, which I had some experience with. SystemTap is a system where you compile source code into a module and then load the result into the kernel. This method was a little risky at the time and kernel crashes were not uncommon. You did however have the power to inject your own functionality before or after kernel functions. However, I found that it had been superseded by something called Berkley Packet Filter (BPF).
With its origins in firewalling, BPF is now a replacement for SystemTap and is able to hook into all the kernel functions, not just in the firewall. The main differences with SystemTap being that BPF code is executed by a simple VM running in the kernel itself instead of being loaded as a kernel module. This greatly improves stability in the kernel, leading to less crashes. The other difference is, that the source code written for these filters is very alike Awk code and a lot easier implement.
I’ll give a quick example:
# Installation is easy. Pick your flavor:
yum install bpftrace kernel-devel
apt install bpftrace

# Then our first program. I'll save you the 'Hello world' for something a little more interesting:
bpftrace -e 'tracepoint:syscalls:sys_enter_open {printf("%s %s\n", comm, str(args->filename));}'
If you are able to run this, you will see program names followed by the file being opened. (Since there are more ways to open files, you won’t see all files on the system being opened.) You can exit with CTRL-C.
So now that we have a way to tap into the kernel, it’s time to think about how to get the information that we need. We’re interested in two things. The data send and received for NFS and the same for CIFS. Now the data for CIFS will be over TCP since UDP is only used in the old outdated versions. For NFS both TCP and UDP are allowed but NFSv4 requires TCP. A quick look with ‘nfsstat’ shows that our clients only use version 4 to communicate with our NFS servers.
Now, we could intercept all network packets and check the port numbers to see if they land on our CIFS or NFS ports, but we can simply check the program name associated with the functions that we hook into. This leads us to our last problem. Which functions do we hook into?
This is by far the hardest problem. The data that is send and received go through quite a number of network functions, some adding and some remove layers from our data. And not all functions are aware of the IP addresses. For the receive function for example, we only want to look at a network packet once it has been completely assembled. And there are multiple ways of sending and receiving data. How to we know which ones the program uses?
To get some more insight we’re going to hook a whole bunch of kernel functions at the same time and then see which ones are actually being used. We’ll start with CIFS:
bpftrace -e 'kprobe:tcp_* /comm == "smbd" / { @[probe] = count();} i:s:10 {exit();}' | \
  grep "^@" | sort > bpf_hits.txt
What we do here is hook all functions that start with ‘tcp_’ and if they are triggered for a program called ‘smbd’ we increment a counter with the name of that function. The second part is an alarm function that gets called after 10 second which stops the script. When the script ends, it will print out the list of variables automatically. We end up with a file that looks something like:
@[kprobe:tcp_ack]: 1653
@[kprobe:tcp_ack_update_rtt.isra.45]: 1591
@[kprobe:tcp_add_backlog]: 3283
@[kprobe:tcp_assign_congestion_control]: 1
@[kprobe:tcp_ca_openreq_child]: 1
@[kprobe:tcp_check_req]: 1
@[kprobe:tcp_check_space]: 1643
@[kprobe:tcp_child_process]: 1
@[kprobe:tcp_chrono_start]: 1186
@[kprobe:tcp_chrono_stop]: 2788
@[kprobe:tcp_clean_rtx_queue]: 1582
...
Now there are still a lot results, but a quick grep later:
grep -e send -e recv bpf_hits.txt
@[kprobe:tcp_event_data_recv]: 16762
@[kprobe:tcp_recvmsg]: 13321
@[kprobe:tcp_send_ack]: 12320
@[kprobe:tcp_send_delayed_ack]: 16425
@[kprobe:tcp_sendmsg]: 858
@[kprobe:tcp_sendmsg_locked]: 858
@[kprobe:tcp_send_mss]: 862
@[kprobe:tcp_v4_send_check]: 2860
A quick look at the functions we found:
- int inet_recvmsg(struct socket *sock, struct msghdr *msg, size_t size, int flags)
- int tcp_sendmsg(struct sock *sk, struct msghdr *msg, size_t size)
These are the functions used by smbd to send and receive its network traffic. The sock and socket struct can be used to find the source/destination IP and port.
However once we hook kprobe:inet_recvmsg we soon find out that the socket struct passed to this function is still empty! Which is logical if we think about it; this function’s job is to fill it. So how do we get our hands on the filled struct? There is a kretprobe:inet_recvmsg option but we can only retrieve the return value of a function with this, the socket struct is not available this way.
Luckily there is a function that is called by inet_recvmsg itself with the data we need, namely the tcp_cleanup_rbuf function!
As you can see we both get a filled sock struct and a size of the data passed. With this information we can start building our BPF script:
bpftrace -e '
#define PROGRAM "smbd"

kprobe:tcp_sendmsg / comm == PROGRAM /
{
$size  = (uint32) arg2;
@send_total = @send_total + $size;
}

kprobe:tcp_cleanup_rbuf / comm == PROGRAM /
{
$size  = (uint16) arg1;
@recv_total = @recv_total + $size;
}

interval:s:10
{
print(@recv_total);
clear(@recv_total);

print(@send_total);
clear(@send_total);
}'
As you can see we hook two functions; one for the data that is received and one for the data that is send. Note that I cast the arguments to a named variable. I strongly recommend this so bpftrace will know the type of the data and it will prevent you from making mistakes later on with what an argument represents. A total is kept and once every 10 seconds they are printed to the screen and reset. Already this is enough to send to Zabbix but we’ll expand this a bit further first.
We copy this script to our NFS server, change the program name to nfsd and run it. But what is this? We only see recv_total begin printed! It turns out that nfsd is using a different function to send its data to clients. Luckily we can see that the received data accounting is working just fine. But what is nfsd doing differently? We run the previous command to bind all the TCP functions again but this time for nfsd and we get this result:
bpftrace -e 'kprobe:tcp_* /comm == "nfsd" / { @[probe] = count();} i:s:10 {exit();}' | grep "send" | sort
@[kprobe:tcp_send_ack]: 42444
@[kprobe:tcp_send_delayed_ack]: 19057
@[kprobe:tcp_send_dupack]: 1
@[kprobe:tcp_send_fin]: 1
@[kprobe:tcp_send_mss]: 309911
@[kprobe:tcp_sendpage]: 304337
@[kprobe:tcp_v4_send_check]: 53662
Looks like nfsd is using the tcp_sendpage function in an effort to work more efficiently. A quick look at this function shows that it also uses a sock struct.
Time to alter our script. This time I also print a line after our output.
bpftrace -e '
#define PROGRAM "nfsd"

kprobe:tcp_sendpage / comm == PROGRAM /
{
$size  = (uint32) arg3;
@send_total = @send_total + $size;
}

kprobe:tcp_sendmsg / comm == PROGRAM /
{
$size  = (uint32) arg2;
@send_total = @send_total + $size;
}

kprobe:tcp_cleanup_rbuf / comm == PROGRAM /
{
$size  = (uint16) arg1;
@recv_total = @recv_total + $size;
}

interval:s:10
{
print(@recv_total);
clear(@recv_total);

print(@send_total);
clear(@send_total);

printf("@---\n");
}'
Now we have something that works for both smbd and nfsd. While I haven’t implemented extracting the IP address in the examples, the totals is all I need for Zabbix for now.
There are several ways to get the data to Zabbix but since we’re generating the data in our own pace, the best way to do so is by defining a Zabbix trapper item so we can send data when it’s ready. To get data to a trapper item we use the zabbix_sender program. And while we can spawn this program from within our BPF filter, it is a much better idea to run something in userspace in parallel so that we don’t interfere with our filter and make it miss packets. Since we already output data to the screen the easiest way to do so is via a pipe into awk.
# Put this right behind the end of the bpftrace command. (Do not include this comment)
| awk '
BEGIN{
FS=OFS=" ";
result="";
}

# No lines that do not start with a @
!/^@/ {next;}

# Since totals are over a period of 10 seconds, divide by 10 to get a "per second" number. The int() rounds down
/^@recv/ || /^@send/ {
$2 = int($2/10);
}

# If we run into a line (the end of our output) we start sending what we have
/^@---$/ {
epoch=systime();
cmd="/usr/local/bin/zabbix_sender -z 10.0.0.1 -s cifs_server1 -k cifs_traffic " \
    "-o \"@time: " epoch "\n" result "\"";
system(cmd);
result="";
next;
}

# Add the current line to the message we are going to send
{
result=result $0 "\n"
}'
Here we save up lines that start with a @ while fixing up numbers where needed. Once we encounter a @— we send our whole message to Zabbix and repeat. Since I’ve had BPF filters die on some servers (probably due to kernel bugs) I usually put this script into a loop. Simply add it to /etc/rc.local to start at bootup.
screen -S zabbix_bpf -fn -d -m bash -c "while true; do { /root/bpf/bpf_cifs_nfs.sh; } done"Now all that is left to do is to let Zabbix graph your data. Simply add two new items (one for send and one for received data) to the host (or template) that receives your data. Make them ‘dependent items‘ with the ‘master item‘ pointing at the trapper item. Now add the following line to the Preprocessing steps:
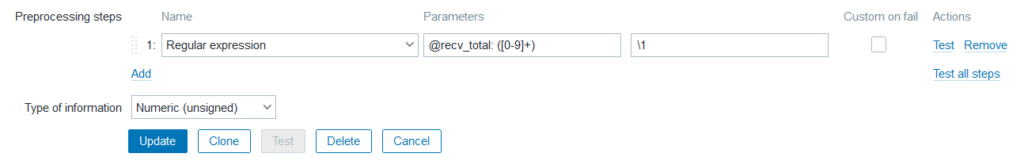
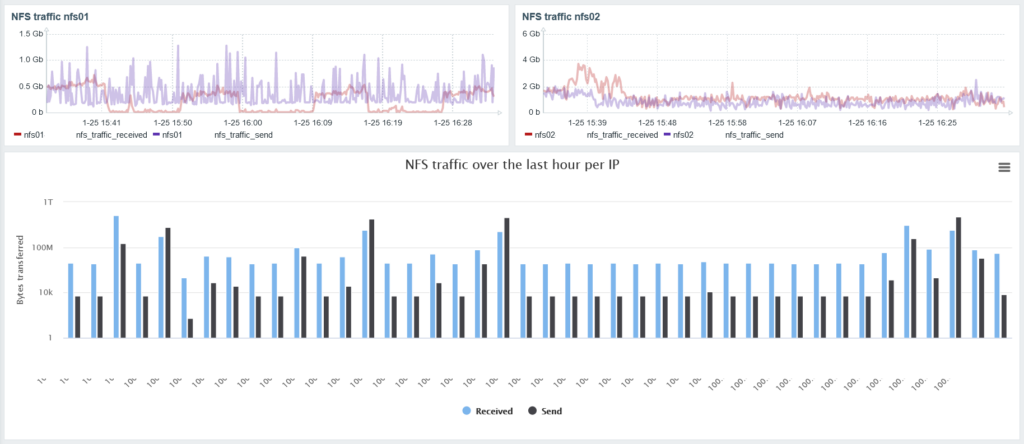
With that data you can simply make a graph in a dashboard. With some extra work, you can use the data per IP address to make a usage per client graph as seen below (I edited out some IP addresses):
I hope this was educational. If you have any questions, feel free to leave them below. In the meantime, here’s a download link for the complete script: bpf_cifs_nfs.sh